As I’m finishing up another paper from my Ph.D. study, I realized this one is a bit too long. While I’d defend myself by saying this is what is needed in order to reproduce the results (which was indeed my intention during the writing process), I do feel somewhat insecure. So, I did some research on the paper length by studying three example researchers that I admire. For convenience, let’s call them Dr. Soda, Dr. Jelly, and Dr. Butter.
There are many ways to obtain the publication records, such as by web crawling or by downloading from your favorite databases. I chose the latter because it’s just so simple. The publications considered here are limited to:
- Web of Science Core Collection
- Research Article, i.e., not considering Review, Data Paper, Editorial, Conference Proceedings, etc.
- Last accessed date: 11/17/2024
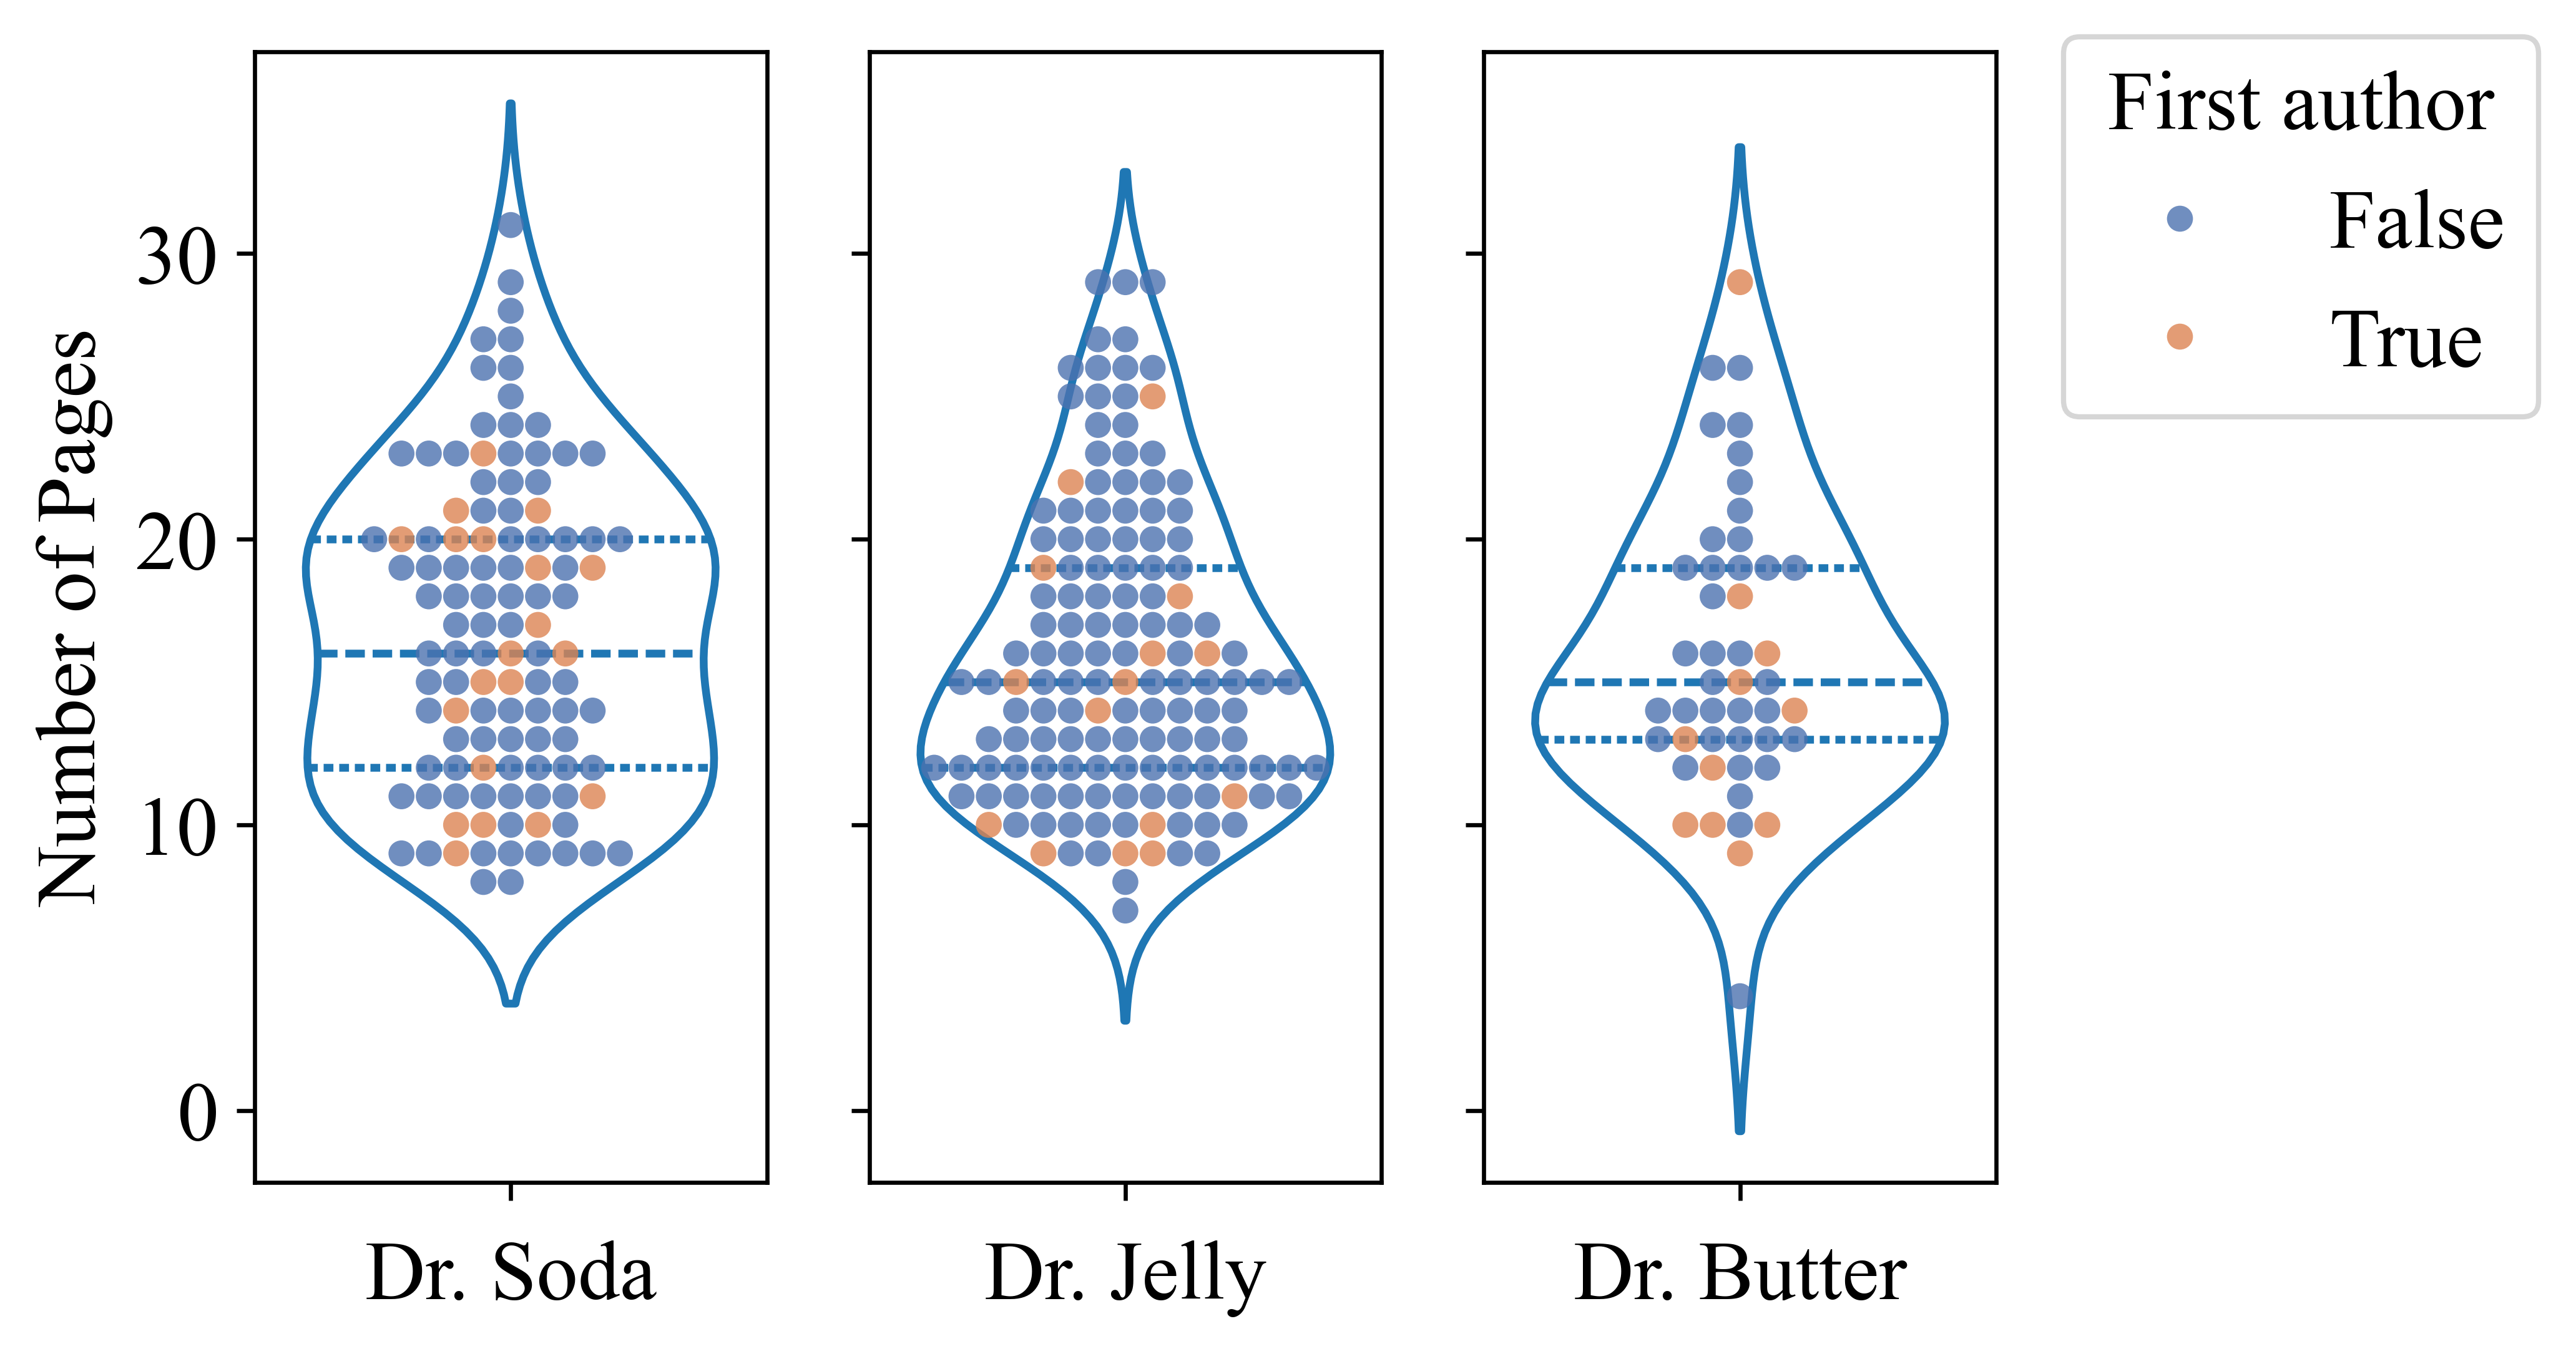
With the above filters, Dr. Soda, Dr. Jelly, and Dr. Butter are associated with 109 papers, 142 papers, and 47 papers, respectively. Figure 1 visualizes the number of pages of these papers, where the violin plots also show the quartiles. Based on the shapes of the violin plots, it looks like Dr. Jelly tends to produce shorter papers and has more records proving this. This is exactly what I sensed when reading Dr. Jelly’s work, and I wonder what the trick is, really. The mean and median number of pages are given as follows:
- Dr. Soda: mean = 16.70, median = 16.
- Dr. Jelly: mean = 15.88, median = 15.
- Dr. Butter: mean = 15.94, median = 15.
As we know, once someone becomes a PI, they would typically retire from being the first author. I was curious about whether these three researchers themselves tend to write long or short papers when they were students or post-doc. So, I used different hues in the swarm plots to indicate this. It seems that all three Drs once wrote short and long papers, but notebly Dr. Butter wrote his/her longest paper!
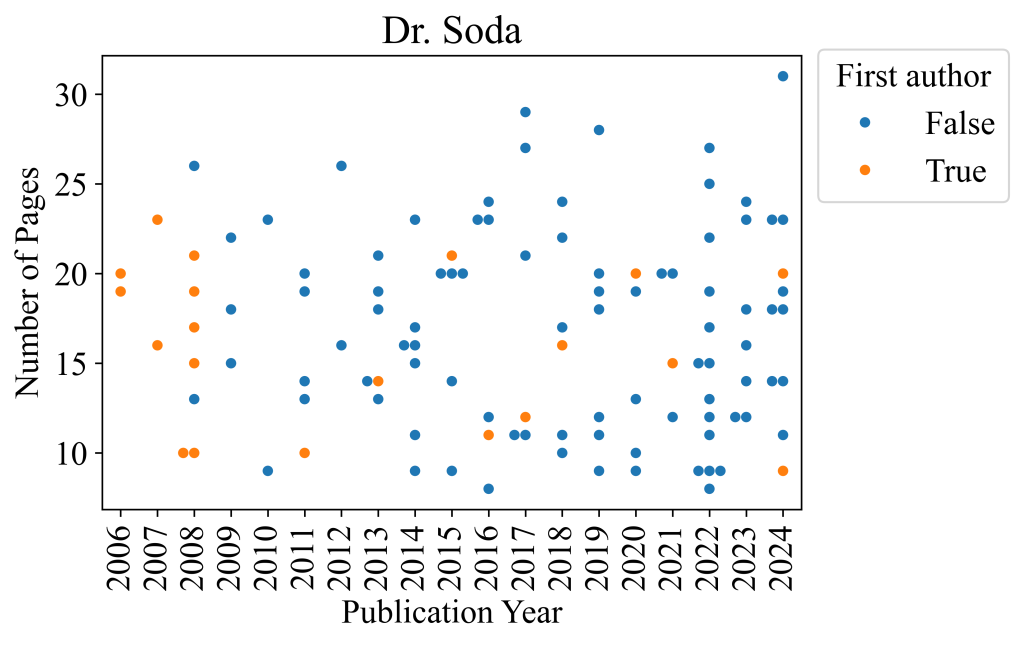
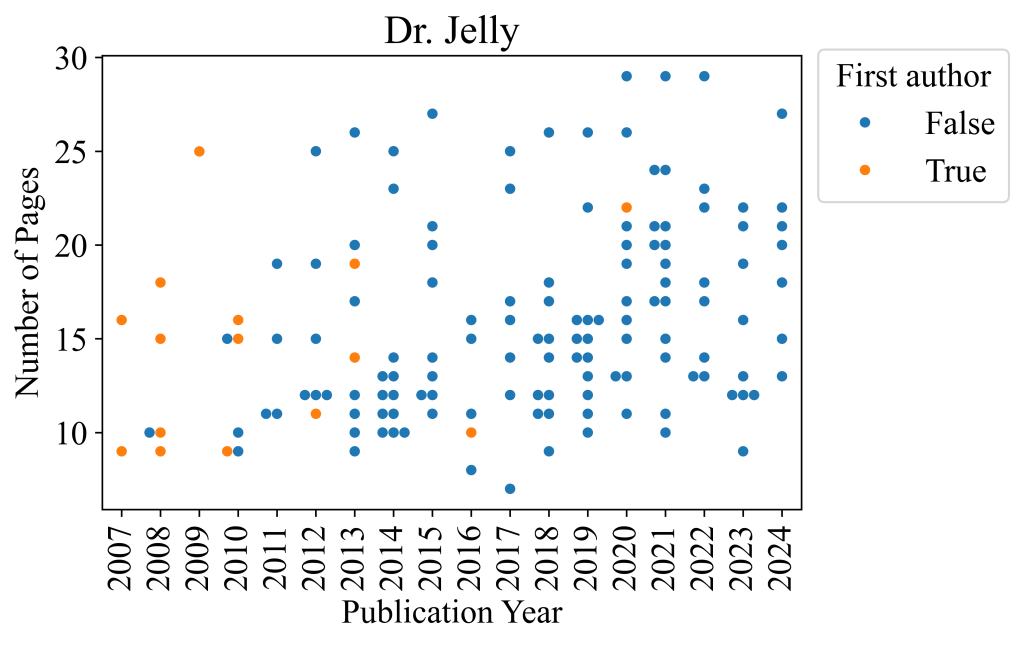
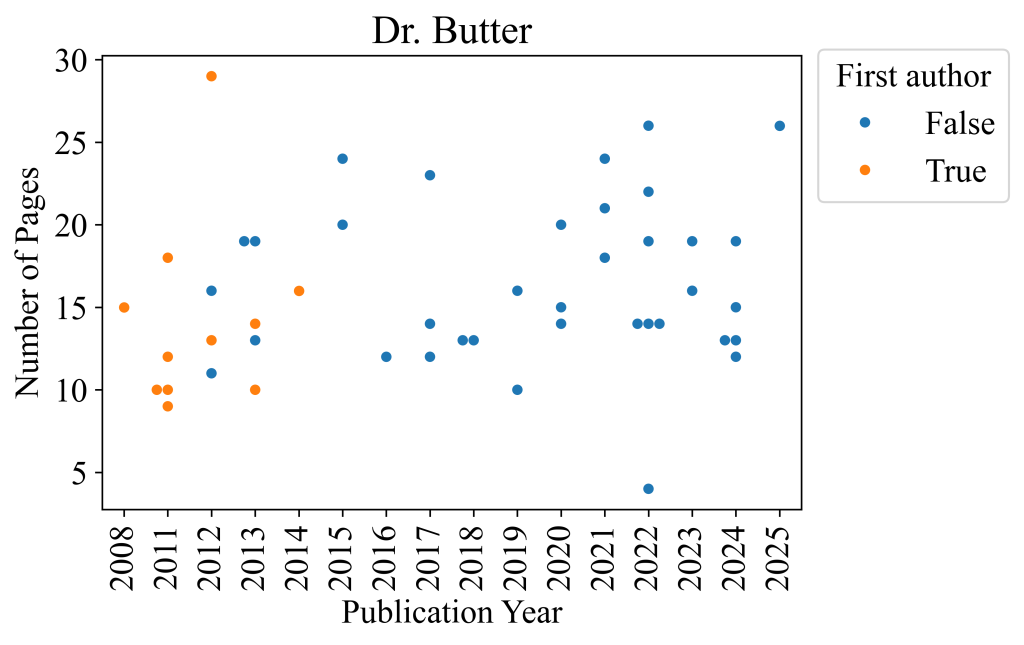
By Figure 2, I was trying to investigate whether there is any trend in the number of papers over time. It looks like there is no such trend in all three researchers. But I had some interesting findings. The three Drs had their first publications almost at the same year, so I guess we can say they are peers. Surprisingly, Dr. Soda seems to keep writing papers (as the first author) over the years. I’d interpret this as Dr. Soda still does some research in the front line, which is just so amazing and luxury. Go my academic crush! In comparison, Dr. Jelly and Dr. Butter had their lastest first-authored papers in 2020 and 2014, respectively. In addition, we can see the strong publication momentum in Dr. Jelly and Dr. Soda. Jiayou, Dr. Butter!
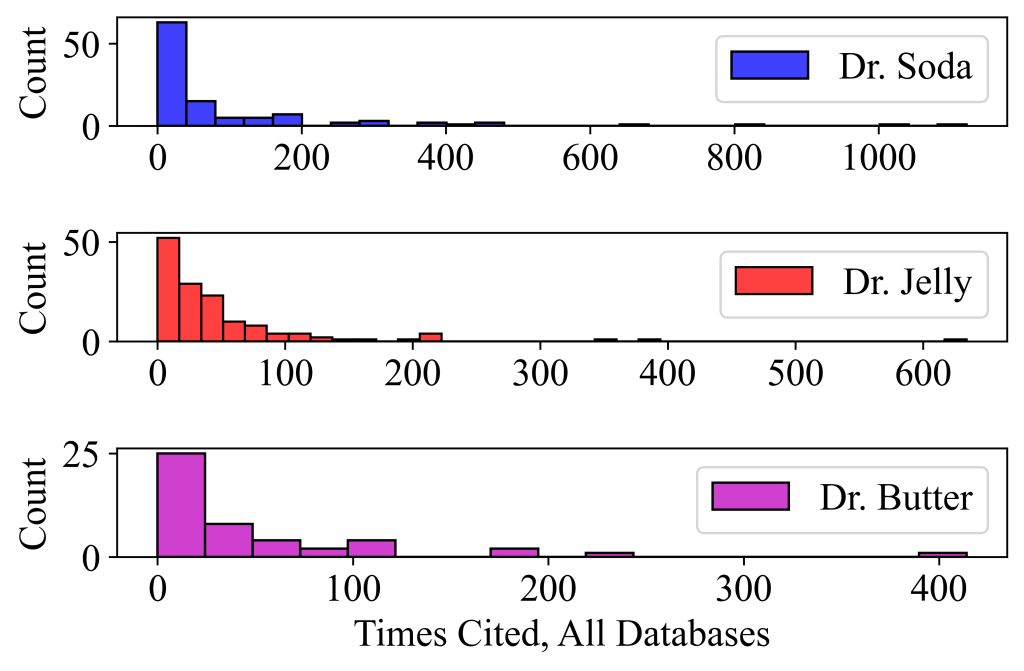
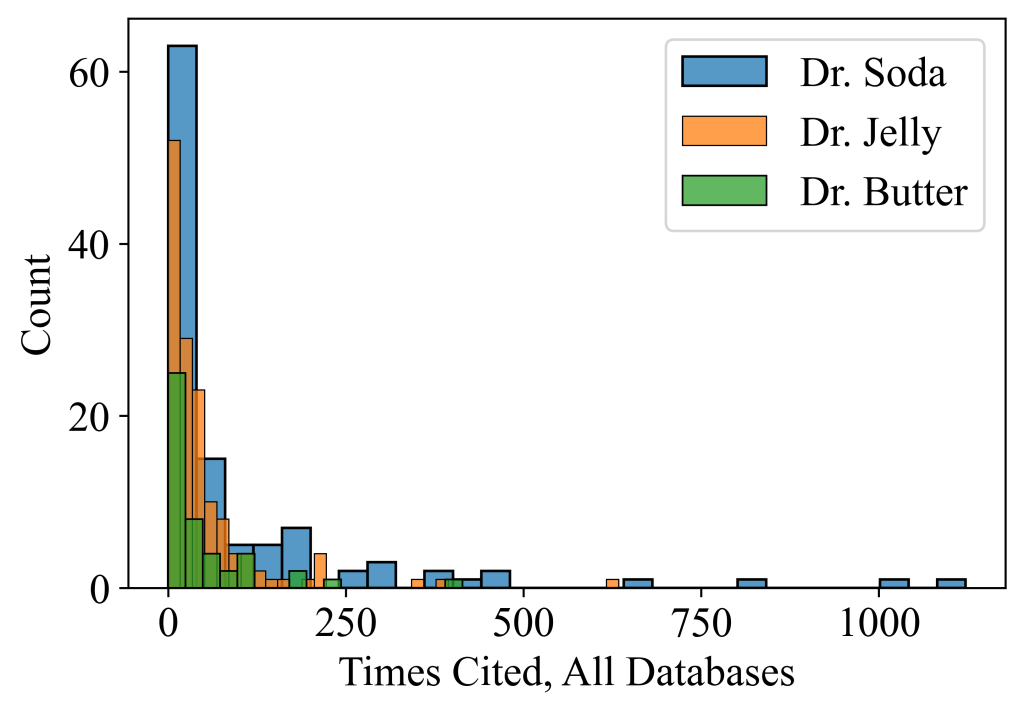
Although my initial motivation was about the paper length, I deviated to look at other metrics as well. Yes, let’s look at the citations that ‘everyone’ cares about. Figure 3 and Figure 4 show the citations of the papers but in diffrent ways. Dr. Soda has publications that exceed 1000 citations. This is awe-inspiring in the field of civil engineering, especially when it’s not a Review paper. But honestly, Dr. Jelly and Dr. Butter’s work also received remarkable citations. It’s my dream to do high impact work like them! The mean and median number of citations are given as follows:
- Dr. Soda: mean = 102.4, median = 28.
- Dr. Jelly: mean = 50.1, median = 28.
- Dr. Butter: mean = 49.5, median = 23.
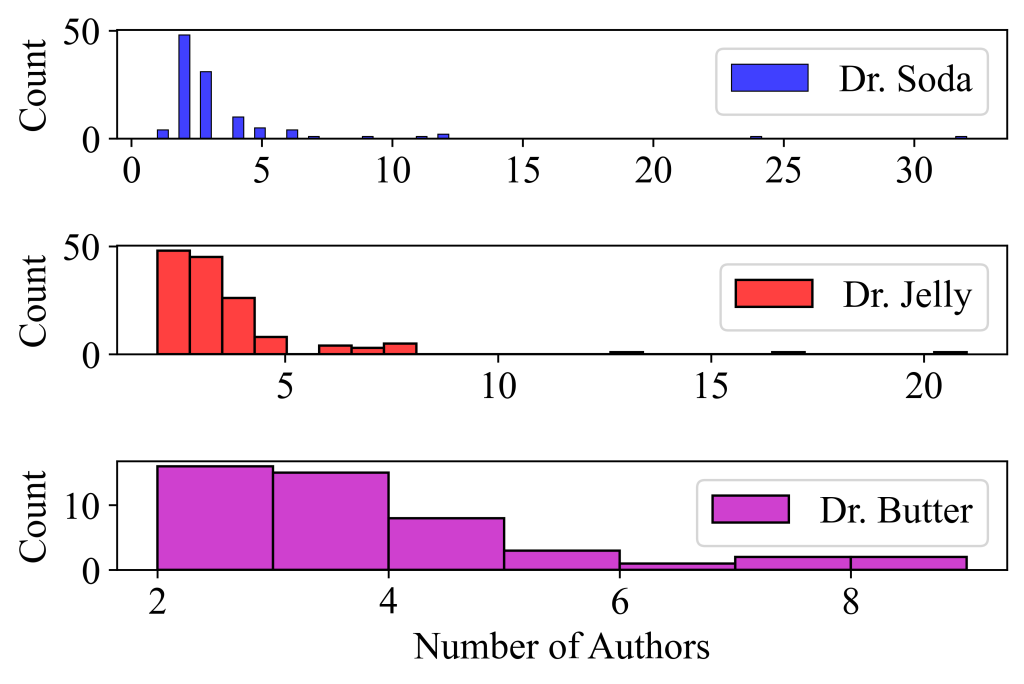
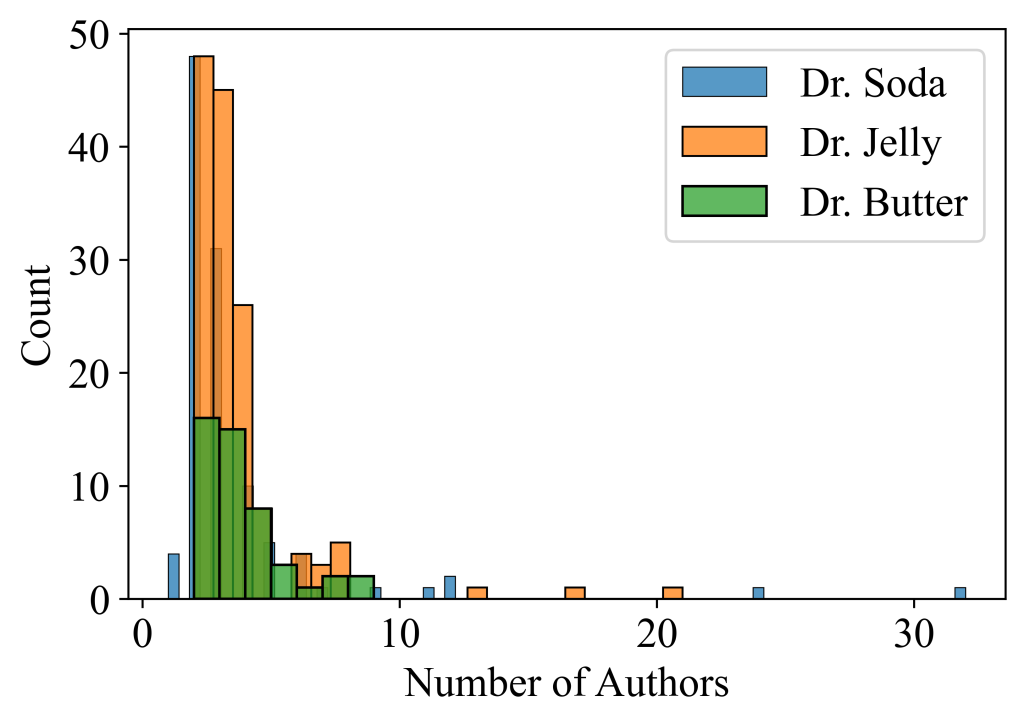
Another metric I looked at is the number of authors in each paper. Intuitively, I think having more collaborators can lead to more publications and maybe also longer papers. Figures 5 and 6 show the number of authors of the papers but I did’t (forgot to) relate it to the the corresponding number of pages. In any case, it looks like Dr. Soda and Dr. Jelly were involved in some crowded papers that carry 10+ authors. In contrast, Dr. Butter is quite ‘conservative’ in this regard. The majority of the papers reasonably carry 2~4 authors in all three Drs. The mean and median number of authors are given as follows:
- Dr. Soda: mean = 3.57, median = 3.
- Dr. Jelly: mean = 3.60, median = 3.
- Dr. Butter: mean = 3.45, median = 3.
While the medians are the same, Dr. Jelly has the highest mean number of authors per paper, followed by Dr. Soda and Dr. Butter. This may be explained by the fact that Dr. Jelly is involved in many large, multi-institution projects. Or maybe Dr. Jelly is simply good at fostering collaborations?
Any guesses on who Dr. Soda, Dr. Jelly, and Dr. Butter are? Drop me a line:)